Dashboard Budget Report
Usage
Budget Dashboard provides onscreen chart reports based on the cost assigned to staff members, the amount of time the staff members have been scheduled as a comparison to the budget assigned to a specific unit.
Report Parameters
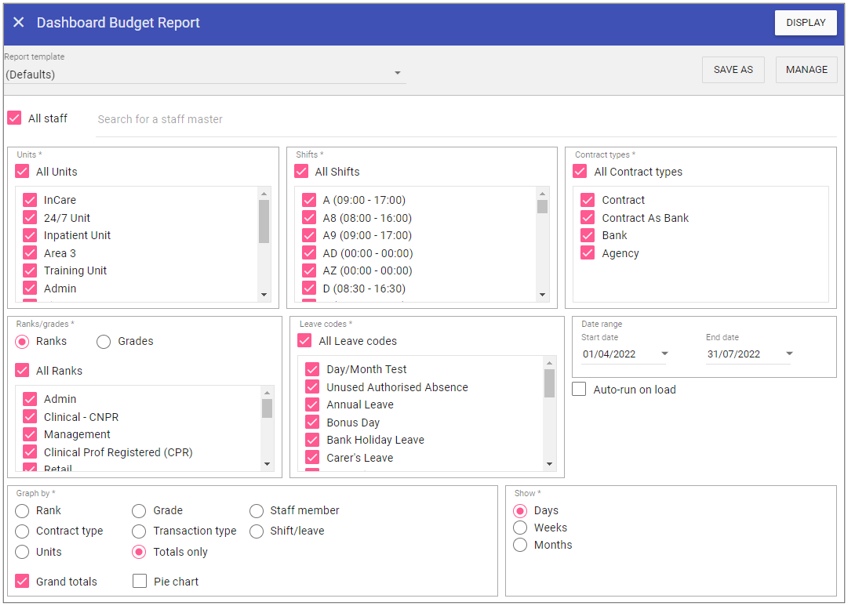
All Staff: Ticking the All staff box, runs the report on every staff member stored in Staff.Care that matches the report criteria.
To add single or multiple specific staff members, type the name of the staff member you wish to search in the search field and select the staff member/s by clicking on the auto complete drop down menu.
Units: When selected the report will not filter by primary unit (unless you sort by ‘Unit’), however this can be unchecked and individual units selected from the list allowing you to filter by primary unit.
Shifts: Select the shifts to be reported on.
Contract Types: Captures staff members based on the staff type set up in Admin.
Ranks/Grades: Capture staff members who have the rank/grade assigned to their contract during the reporting period.
Leave Codes: As with primary units, if this is selected the report will not filter by Leave type (unless you sort by ‘Leave’), however when unchecked individual leaves can be selected from the list allowing you to filter by the leave type.
Start Date: Enter the start date of the report.
End Date: Enter the end date of the report.
Auto-run on load: If
checked, bypasses the parameters and
loads the graphs on entry to the Budget
Dashboard using the last known defaults.
Graph by
Rank: Will produce graphs by ranks.
Grade: Will produce graphs by each grade.
Staff member: Will produce a graph for up to a MAXIMUM OF 20 STAFF MEMBERS.
Contract type: Will produce graphs by each contract type.
Transaction type: Will produce graphs by transaction type, Shift & Leave.
Shift/leave: Will produce a graph based on each unique shift code and leave code.
Units: Will produce graphs based on selected units.
Totals only: Displays a graph showing only total values.
Grand totals: Produces an additional graph displaying combined grand totals.
Pie chart: Displays an additional pie chart summary.
Show
Days: Produces a bar for each DAY within the selected period.
Weeks: Produces a bar for each WEEK within the selected period.
Months: Produces a bar for each MONTH within the selected period.
Running the Report
Complete all report parameters including the date range.If you want the report in CSV format tick Output to File.
If PDF output only is required, the Output to File check box does not need to be ticked.
Click Generate.
The report is complete will be displayed at the top of the page.
Click View Report to view the PDF output.
Click Open File to view the .CSV output.